Subscription

Stock Illustration: Pie chart percentage icons set. Segment infographic. Circle graph statistic diagram. 25,50,60,75 slice element. Data information. Finance document presentation. Management report. Vector illustration

Item number : 88079603 See all

This Stock Illustration, whose title is "Pie chart percentage icons set. Segment..."[88079603], includes tags of chart, infographic, vector. The author of this item is Lovecta (No.1795173). Sizes from S to XL including Vector are available and the price starts from US$5.00. You can download watermarked sample data (comp images), check the quality of images, and use Lightbox after signing up for free. See all
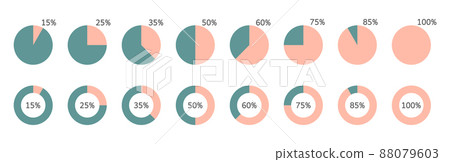
Pie chart percentage icons set. Segment infographic. Circle graph statistic diagram. 25,50,60,75 slice element. Data information. Finance document presentation. Management report. Vector illustration 88079603

Pie chart percentage icons set. Segment infographic. Circle graph statistic diagram. 25,50,60,75 slice element. Data information. Finance document presentation. Management report. Vector illustration

  • 1:1
  • 4:3
  • 4:5
    (8:10)
  • 3:2(6:4)
  • Custom
    :

Scale

* You can move the image by dragging it.

S
  • 640 x 202px
  • 22.6 x 7.1cm (72dpi)
JPG US$5.00
M
  • 2000 x 633px
  • 16.9 x 5.4cm (300dpi)
JPG US$15.00
L
  • 4000 x 1266px
  • 33.9 x 10.7cm (300dpi)
JPG US$30.00
XL
  • 8192 x 2594px
  • 69.4 x 22.0cm (300dpi)
JPG US$50.00
V Vector EPS US$35.00
Ex Add an Extended License +US$30.00
Total :
Design with this image

With this editor tool,
you can create a design with PIXTA items before purchasing.
Click here for details.

Stock Illustration: Pie chart percentage icons set. Segment infographic. Circle graph statistic diagram. 25,50,60,75 slice element. Data information. Finance document presentation. Management report. Vector illustration tags

chart  infographic  vector  icon  pie  percentage  set  circle  graph  statistic  diagram  segment  25  50  60  75  slice  element  data  information  finance  document  presentation  management  report  illustration  15  35  85  100  graphic  info  round  web  business  bar  percent  progress  layout  marketing  design  template  financial  plan  wheel  part  phase  white  schedule  color 
Description / Comment
Pie chart percentage icons set. Segment infographic. Circle graph statistic diagram. 25,50,60,75 slice element. Data information. Finance document presentation. Management report. Vector illustration.