Subscription
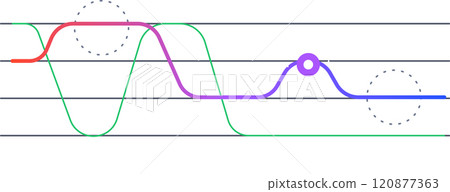
Stock Illustration: Colorful line graphs fluctuating over a grid represent business performance, data analysis, and market trends, with highlighted points indicating key moments or significant changes
Item number : 120877363 See all
This Stock Illustration, whose title is "Colorful line graphs fluctuating over a grid..."[120877363], includes tags of business, chart, analysis. The author of this item is WinWin (No.1628623). Sizes from S to XL including Vector are available and the price starts from US$5.00. You can download watermarked sample data (comp images), check the quality of images, and use Lightbox after signing up for free. See all
Colorful line graphs fluctuating over a grid represent business performance, data analysis, and market trends, with highlighted points indicating key moments or significant changes
Scale
* You can move the image by dragging it.
Credits(copyright) : WinWin / PIXTA
- About Model and Property Release
- Views : 55
- Past purchases : No
- Contact Contributor to Ask About This Item
